Water Offsets Ltd
Satellite-Based Water Quality Monitoring for Rivers and Coastal Waters – Brighton & Hove
Satellite-Based Water Quality Monitoring for Rivers and Coastal Waters – Brighton & Hove
Details:
- Company: Water Offsets Ltd
- Client: Brighton & Hove Seawater Testing Project
- Year: 2025
- Region: England
Service areas:
- Geographical information systems (GIS) and mapping
- Environmental and sustainability services
- Artificial intelligence (AI) and software solutions
Introduction
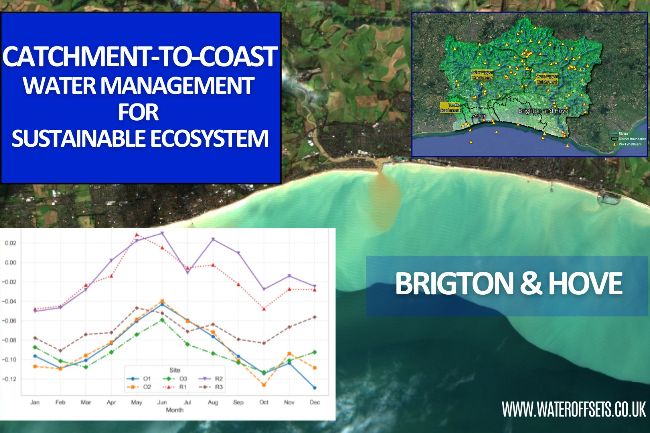
This case study demonstrates the use of satellite Earth observation to monitor water quality across riverine and coastal environments in Brighton & Hove. Using long-term satellite-derived indices, the analysis provides spatially consistent insights into chlorophyll levels, turbidity, and nutrient-related dynamics in rivers and nearshore waters. The work focuses on multiple locations along the River Adur and adjacent coastal zones, capturing seasonal patterns, long-term trends, and relationships between water quality indicators. The approach shows how remote sensing can support environmental assessment, planning decisions, and regulatory understanding by providing continuous, area-wide monitoring that complements traditional point-based sampling.
Challenges
Water quality monitoring in coastal and river systems is traditionally limited by sparse sampling locations, inconsistent temporal coverage, and high monitoring costs. Rivers and coastal waters are dynamic systems influenced by wastewater discharges, agricultural runoff, rainfall, sediment resuspension, and seasonal ecological processes. Point measurements alone struggle to capture these spatial variations, making it difficult to distinguish localised impacts from wider catchment-scale drivers. In Brighton & Hove, understanding the interaction between river inputs, coastal mixing, turbidity, and algal growth is particularly important for environmental management, bathing water quality, and planning-related assessments. Without long-term, spatially consistent data, decision-makers risk relying on partial evidence, limiting their ability to identify trends, detect episodic events such as algal blooms, or evaluate the effectiveness of management interventions.
Solutions
Satellite Earth observation was used to derive three widely recognised water quality indices: the Maximum Chlorophyll Index (MCI), Normalised Difference Chlorophyll Index (NDCI), and Normalised Difference Turbidity Index (NDTI). These indices were calculated for multiple river and coastal locations using consistent satellite imagery spanning 2017–2025. By analysing time-series statistics, seasonal averages, and correlations between indices, the approach provides insight into phytoplankton activity, nutrient enrichment, and suspended sediment dynamics across the system. Spatial comparison between upstream river sites, downstream locations near wastewater inputs, estuarine zones, and coastal reference areas allows pressures to be contextualised. The method translates complex spectral data into interpretable indicators that can be visualised, compared over time, and integrated into GIS-based planning and environmental assessment workflows.
Results
The analysis shows that riverine locations exhibit higher and more variable chlorophyll levels than coastal waters, indicating greater nutrient influence and episodic algal blooms. Coastal waters display consistently lower chlorophyll but higher turbidity, driven largely by wave-induced sediment resuspension rather than biological activity. Distinct seasonal patterns are evident, with river chlorophyll peaking in winter and spring, and turbidity increasing in summer and early autumn. Strong negative correlations between chlorophyll indices and turbidity highlight the optical trade-off between algal growth and suspended sediments. Long-term trends suggest periods of improvement followed by renewed variability, emphasising the need for continued monitoring. Overall, the study demonstrates how satellite-derived indices provide robust, scalable evidence to support water quality assessment, environmental management, and planning-related decision-making in complex river–coast systems.